Good communication fosters the advance of science and returns value to society. We develop visual strategies to help scientists communicate their research with the most suitable solution for each dataset and story.
Summary
We create communication products that showcase scientific research in the most effective ways possible by combining scientific data visualization, storytelling, and computer graphics imaging.
Our two major targets are Scientists and Society.
We produce the most suitable solutions depending on the characteristics of the research project, the type and origin of the data, and the intended audience. Our products may be movies, images, or more complex displays, and can be used for dissemination and outreach, technical reports, or as visual analysis tools.
Our work is mostly based on large datasets resulting from computer simulations that use HPC resources. Thus, apart from applying our background in graphic design, film production, and visual communication, we develop a variety of programs, plug-ins, and pieces of code to grab, process, and convert simulation data to suitable formats. A key part of our team's workflow is the constant collaboration between scientists, programmers, and designers to create imagery that is scientifically accurate and visually engaging at the same time.
The team blends commercial image generation software with in-house data management tools into a pipeline able to process the large volumes of data generated by high performance computations. Most important in the team's workflow is the constant collaboration between scientists, programmers, and designers to create imagery that is scientifically accurate, visually engaging at the same time.
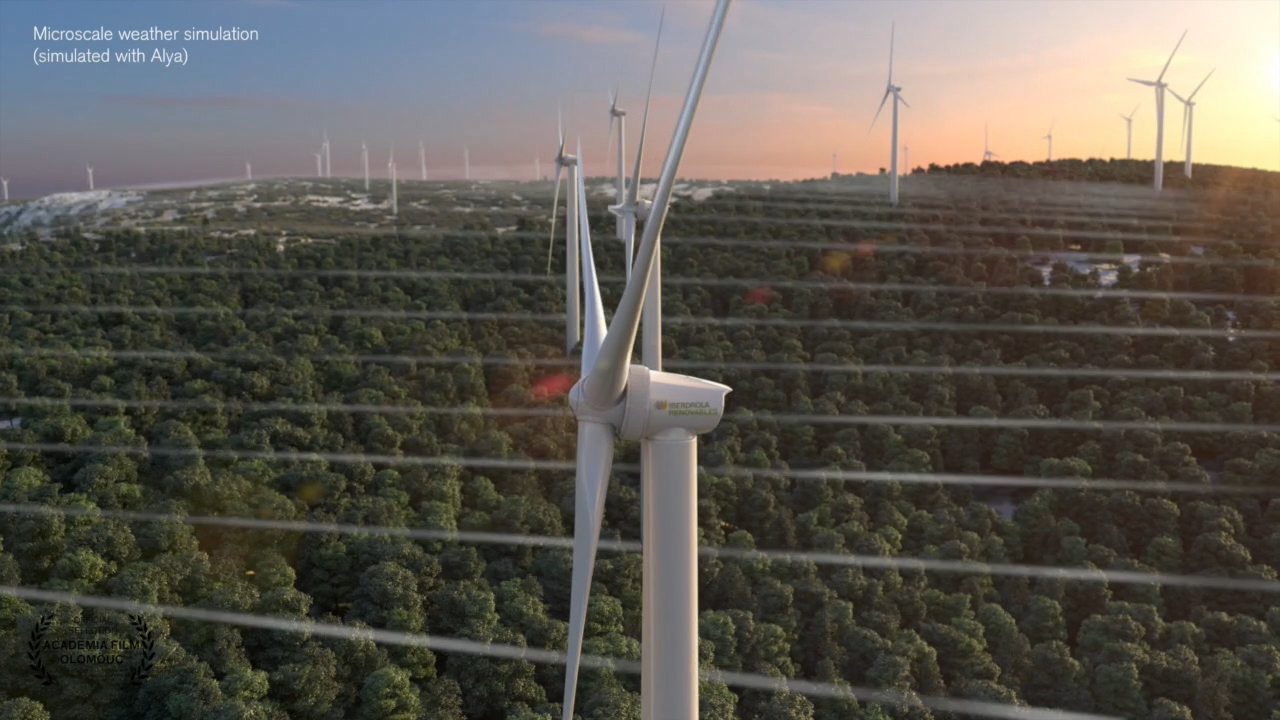
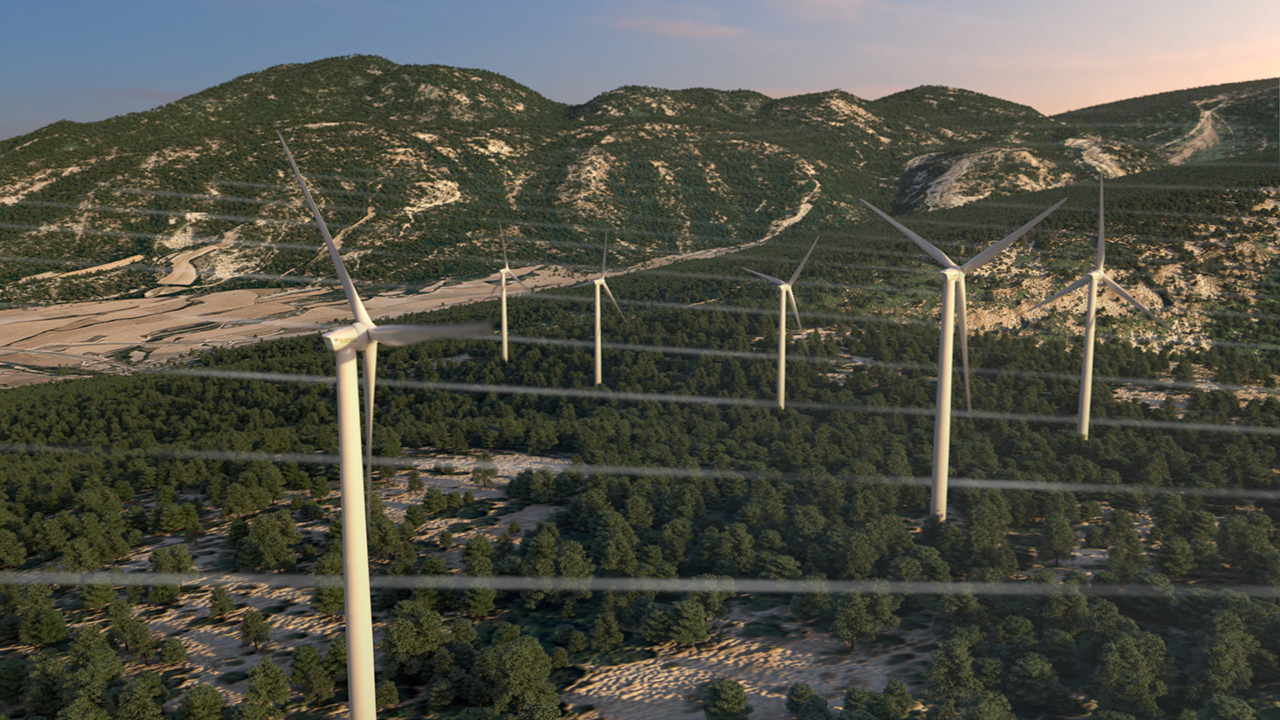
The dissemination work of the team is best exemplified by its short documentaries, featuring hyper-realistic renderings of data visualizations and carefully crafted scripts that have received multiple awards from the International Scientific Visualization Challenge (organized by the National Science Foundation and the Science journal), the international Biennal of Scientific Cinema, the SCINEMA International Film Festival, and the Imagine Science Film Festival.
See the shorts at the BSC’s Scientific Visualization Youtube channel
Objectives
- Create compelling and accurate visualizations using scientific data.
- Explore efficient ways to represent complex data.
- Devise visualizations for scientists to efficiently communicate their data to their peers.
- Communicate the results of research projects to the wider public through dissemination media.
- Develop proprietary tools to process and convert data to standard, commercial formats.