MareNostrum4 User's Guide
Table of Contents
- Introduction
- System Overview
- File Systems
- Data management
- Running Jobs
- Software Environment
- PRACE
- Getting help
- Frequently Asked Questions (FAQ)
- Appendices
Introduction ↩
This user’s guide for the MareNostrum4 cluster is intended to provide the minimum amount of information needed by a new user of this system. As such, it assumes that the user is familiar with many of the standard features of supercomputing as the Unix operating system.
Here you can find most of the information you need to use our computing resources and the technical documentation about the machine. Please read carefully this document and if any doubt arises do not hesitate to contact us (Getting help).
System Overview ↩
MareNostrum4 is a supercomputer based on Intel Xeon Platinum processors from the Skylake generation. It is a Lenovo system composed of SD530 Compute Racks, an Intel Omni-Path high performance network interconnect and running SuSE Linux Enterprise Server as operating system. Its current Linpack Rmax Performance is 6.2272 Petaflops.
This general-purpose block consists of 48 racks housing 3456 nodes with a grand total of 165,888 processor cores and 390 Terabytes of main memory. Compute nodes are equipped with:
- 2 sockets Intel Xeon Platinum 8160 CPU with 24 cores each @ 2.10GHz for a total of 48 cores per node
- L1d 32K; L1i cache 32K; L2 cache 1024K; L3 cache 33792K
- 96 GB of main memory 1.880 GB/core, 12x 8GB 2667Mhz DIMM (216 nodes high memory, 10368 cores with 7.928 GB/core)
- 100 Gbit/s Intel Omni-Path HFI Silicon 100 Series PCI-E adapter
- 10 Gbit Ethernet
- 200 GB local SSD available as temporary storage during jobs ($TMPDIR=/scratch/tmp/[jobid])
The processors support well-known vectorization instructions such as SSE, AVX up to AVX–512.
Remember that the BIOS and kernel reserves memory, so the actual total usable RAM that commands like “free” or “lstopo” report will be slighlty lower than 96GB (~94GB).
Login Nodes ↩
You can connect to MareNostrum using three public login nodes. Please note that only incoming connections are allowed in the whole cluster. The logins are:
    mn1.bsc.es
    mn2.bsc.es
    mn3.bsc.es
Note: Due to the upgrade of MareNostrum the actual login nodes and their configuration changed. If you had access to the system before and the SSH identification of the logins stored in your known_hosts file you might receive the following warning:
@@@@@@@@@@@@@@@@@@@@@@@@@@@@@@@@@@@@@@@@@@@@@@@@@@@@@@@@@@@
@    WARNING: REMOTE HOST IDENTIFICATION HAS CHANGED!     @
@@@@@@@@@@@@@@@@@@@@@@@@@@@@@@@@@@@@@@@@@@@@@@@@@@@@@@@@@@@
IT IS POSSIBLE THAT SOMEONE IS DOING SOMETHING NASTY!
Someone could be eavesdropping on you right now (man-in-the-middle attack)!
It is also possible that a host key has just been changed.
The fingerprint for the RSA key sent by the remote host is
SHA256:sLS2WHI4/tz/dlKt+9Pu9vUcD4HFl/Gg/fGRjNrEkjc.
Please contact your system administrator.
Add correct host key in /home/mlopez12/.ssh/known_hosts to get rid of this message.
Offending RSA key in /home/mlopez12/.ssh/known_hosts:73
  remove with:
  ssh-keygen -f "/home/mlopez12/.ssh/known_hosts" -R mn1.bsc.es
RSA host key for mn1.bsc.es has changed and you have requested strict checking.
Host key verification failed.
This might happen the first time you connect. To solve this issue follow the hint given to remove the offending key by executing the following command
ssh-keygen -f "/home/mlopez12/.ssh/known_hosts" -R mn1.bsc.es
Afterwards you will have the new key stored and the warning should not appear again.
Password Management ↩
In order to change the password, you have to login to a different machine (dt01.bsc.es). This connection must be established from your local machine.
    % ssh -l username dt01.bsc.es

    username@dtransfer1:~> passwd
    Changing password for username.
    Old Password:
    New Password:
    Reenter New Password:
    Password changed.
Mind that the password change takes about 10 minutes to be effective.
File Systems ↩
IMPORTANT: It is your responsibility as a user of our facilities to backup all your critical data. We only guarantee a daily backup of user data under /gpfs/home. Any other backup should only be done exceptionally under demand of the interested user.
Each user has several areas of disk space for storing files. These areas may have size or time limits, please read carefully all this section to know about the policy of usage of each of these filesystems. There are 3 different types of storage available inside a node:
- GPFS filesystems: GPFS is a distributed networked filesystem which can be accessed from all the nodes and Data Transfer Machine
- Local hard drive: Every node has an internal hard drive
- Root filesystem: Is the filesystem where the operating system resides
GPFS Filesystem ↩
The IBM General Parallel File System (GPFS) is a high-performance shared-disk file system providing fast, reliable data access from all nodes of the cluster to a global filesystem. GPFS allows parallel applications simultaneous access to a set of files (even a single file) from any node that has the GPFS file system mounted while providing a high level of control over all file system operations. In addition, GPFS can read or write large blocks of data in a single I/O operation, thereby minimizing overhead.
An incremental backup will be performed daily only for /gpfs/home.
These are the GPFS filesystems available in the machine from all nodes:
/apps: Over this filesystem will reside the applications and libraries that have already been installed on the machine. Take a look at the directories to know the applications available for general use.
/gpfs/home: This filesystem has the home directories of all the users, and when you log in you start in your home directory by default. Every user will have their own home directory to store own developed sources and their personal data. A default quota will be enforced on all users to limit the amount of data stored there. Also, it is highly discouraged to run jobs from this filesystem. Please run your jobs on your group’s /gpfs/projects or /gpfs/scratch instead.
/gpfs/projects: In addition to the home directory, there is a directory in /gpfs/projects for each group of users. For instance, the group bsc01 will have a /gpfs/projects/bsc01 directory ready to use. This space is intended to store data that needs to be shared between the users of the same group or project. A quota per group will be enforced depending on the space assigned by Access Committee. It is the project’s manager responsibility to determine and coordinate the better use of this space, and how it is distributed or shared between their users.
/gpfs/scratch: Each user will have a directory over /gpfs/scratch. Its intended use is to store temporary files of your jobs during their execution. A quota per group will be enforced depending on the space assigned.
Active Archive - HSM (Tape Layer) ↩
Active Archive (AA) is a mid-long term storage filesystem that provides 15 PB of total space. You can access AA from the Data Transfer Machine (dt01.bsc.es and dt02.bsc.es) under /gpfs/archive/hpc/your_group.
NOTE: There is no backup of this filesystem. The user is responsible for adequately managing the data stored in it.
Hierarchical Storage Management (HSM) is a data storage technique that automatically moves data between high-cost and low-cost storage media. At BSC, the filesystem using HSM is the one mounted at /gpfs/archive/hpc, and the two types of storage are GPFS (high-cost, low latency) and Tapes (low-cost, high latency).
HSM System Overview
Hardware
- IBM TS4500 with 10 Frames
- 6000 Tapes 12TB LTO8
- 64 Drives
- 8 LC9 Power9 Servers
Software
- IBM Spectrum Archive 1.3.1
- Spectrum Protect Policies
Functioning policy and expected behaviour
In general, this automatic process is transparent for the user and you can only notice it when you need to access or modify a file that has been migrated. If the file has been migrated, any access to it will be delayed until its content is retrieved from tape.
- Which files are migrated to tapes and which are not?
Only the files with a size between 1GB and 12TB will be moved (migrated) to tapes from the GPFS disk when no data access and modification have been done for a period of 30 days.
- Working directory (under which copies are made)
/gpfs/archive/hpc
- What happens if I try to modify/delete an already migrated file?
From the user point of view, the deletion will be transparent and have the same behaviour. On the other hand, it is not possible to modify a migrated file; in that case, you will have to wait for the system to retrieve the file and put it back on disk.
- What happens if I’m close to my quota limit?
If there is not enough space to recover a given file from tape, the retrieve will fail and everything will remain in the same state as before, that is, you will continue to see the file on tape (in the “migrated” state).
- How can I check the status of a file?
You can use the hsmFileState script to check if the file is resident on disk or has been migrated to tape..
Examples of use cases
    $ hsmFileState file_1MB.dat
    resident -rw-rw-r-- 1 user group 1048576 mar 12 13:45 file_1MB.dat

    $ hsmFileState file_10GB.dat
    migrated -rw-rw-r-- 1 user group 10737418240 feb 12 11:37 file_10GB.dat
Local Hard Drive ↩
Every node has a local solid state drive (SSD) that can be used as a local scratch space to store temporary files during executions of one of your jobs. This space is mounted over /scratch/tmp/$JOBID directory and pointed out by $TMPDIR environment variable. The amount of space within the /scratch filesystem is about 200 GB. All data stored in these local drives at the compute nodes will not be available from the login nodes. You should use the directory referred to by $TMPDIR to save your temporary files during job executions. This directory will automatically be cleaned after the job finishes.
Root Filesystem ↩
The root file system, where the operating system is stored doesn’t reside in the node, this is a NFS filesystem mounted from one of the servers.
As this is a remote filesystem only data from the operating system has to reside in this filesystem. It is NOT permitted the use of /tmp for temporary user data. The local hard drive can be used for this purpose as you could read in Local Hard Drive.
Quotas ↩
The quotas are the amount of storage available for a user or a groups’ users. You can picture it as a small disk readily available to you. A default value is applied to all users and groups and cannot be outgrown.
You can inspect your quota anytime you want using the following command from inside each filesystem:
% bsc_quota
The command provides a readable output for the quota. Check BSC Commands for more information.
If you need more disk space in this filesystem or in any other of the GPFS filesystems, the responsible for your project has to make a request for the extra space needed, specifying the requested space and the reasons why it is needed. For more information or requests you can Contact Us.
Data management ↩
Transferring files ↩
There are several ways to copy files from/to the Cluster:
- Direct scp, rsync, sftp… to the login nodes
- Using a Data transfer Machine which shares all the GPFS filesystem for transferring large files
- Mounting GPFS in your local machine
Direct copy to the login nodes.
As said before no connections are allowed from inside the cluster to the outside world, so all scp and sftp commands have to be executed from your local machines and never from the cluster. The usage examples are in the next section.
On a Windows system, most of the secure shell clients come with a tool to make secure copies or secure ftp’s. There are several tools that accomplish the requirements, please refer to the Appendices, where you will find the most common ones and examples of use.
Data Transfer Machine
We provide special machines for file transfer (required for large amounts of data). These machines are dedicated to Data Transfer and are accessible through ssh with the same account credentials as the cluster. They are:
- dt01.bsc.es
- dt02.bsc.es
These machines share the GPFS filesystem with all other BSC HPC machines. Besides scp and sftp, they allow some other useful transfer protocols:
- scp
    localsystem$ scp localfile username@dt01.bsc.es:
    username's password:

    localsystem$ scp username@dt01.bsc.es:remotefile localdir
    username's password:
- rsync
    localsystem$ rsync -avzP localfile_or_localdir username@dt01.bsc.es:
    username's password:

    localsystem$ rsync -avzP username@dt01.bsc.es:remotefile_or_remotedir localdir
    username's password:
- sftp
    localsystem$ sftp username@dt01.bsc.es
    username's password:
    sftp> get remotefile

    localsystem$ sftp username@dt01.bsc.es
    username's password:
    sftp> put localfile
- BBCP
    bbcp -V -z <USER>@dt01.bsc.es:<FILE> <DEST>
    bbcp -V <ORIG>  <USER>@dt01.bsc.es:<DEST>
GRIDFTP (only accessible from dt02.bsc.es)
SSHFTP
    globus-url-copy -help
    globus-url-copy -tcp-bs 16M -bs 16M -v -vb your_file sshftp://your_user@dt01.bsc.es/~/
Setting up sshfs - Option 1: Linux
Create a directory inside your local machine that will be used as a mount point.
Run the following command below, where the local directory is the directory you created earlier. Note that this command mounts your GPFS home directory by default.
sshfs -o workaround=rename <yourHPCUser>@dt01.bsc.es: <localDirectory>
From now on, you can access that directory. If you access it, you should see your home directory of the GPFS filesystem. Any modifications that you do inside that directory will be replicated to the GPFS filesystem inside the HPC machines.
Inside that directory, you can call “git clone”, “git pull” or “git push” as you please.
Setting up sshfs - Option 2: Windows
In order to set up sshfs in a Windows system, we suggest two options:
sshfs-win
Follow the installation steps from their official repository.
Open File Explorer and right-click over the “This PC” icon in the left panel, then select “Map Network Drive”.
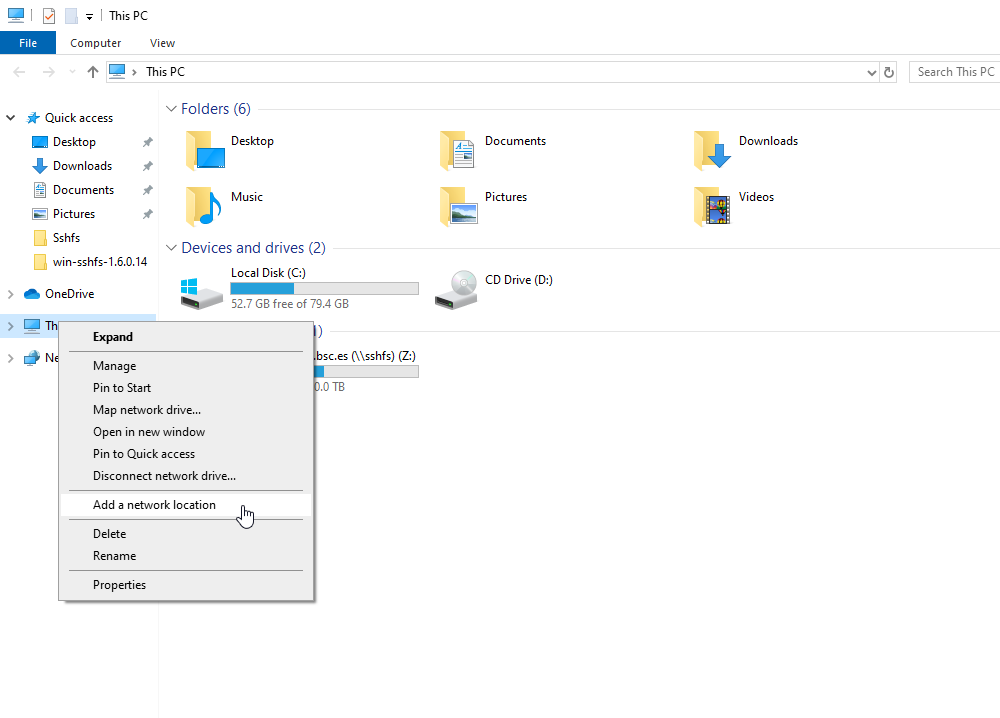
Menu selection - In the new window that pops up, fill the “Folder” field with this route:
\\sshfs\<your-username>@dt01.bsc.es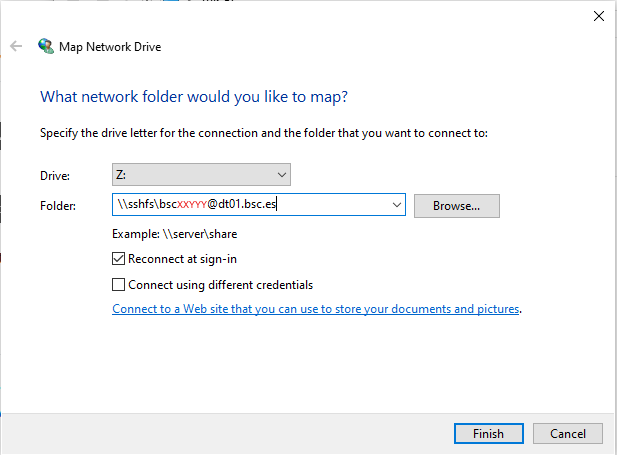
Example - After clicking “Finish”, it will ask you for your credentials and then you will see your remote folder as a part of your filesystem.
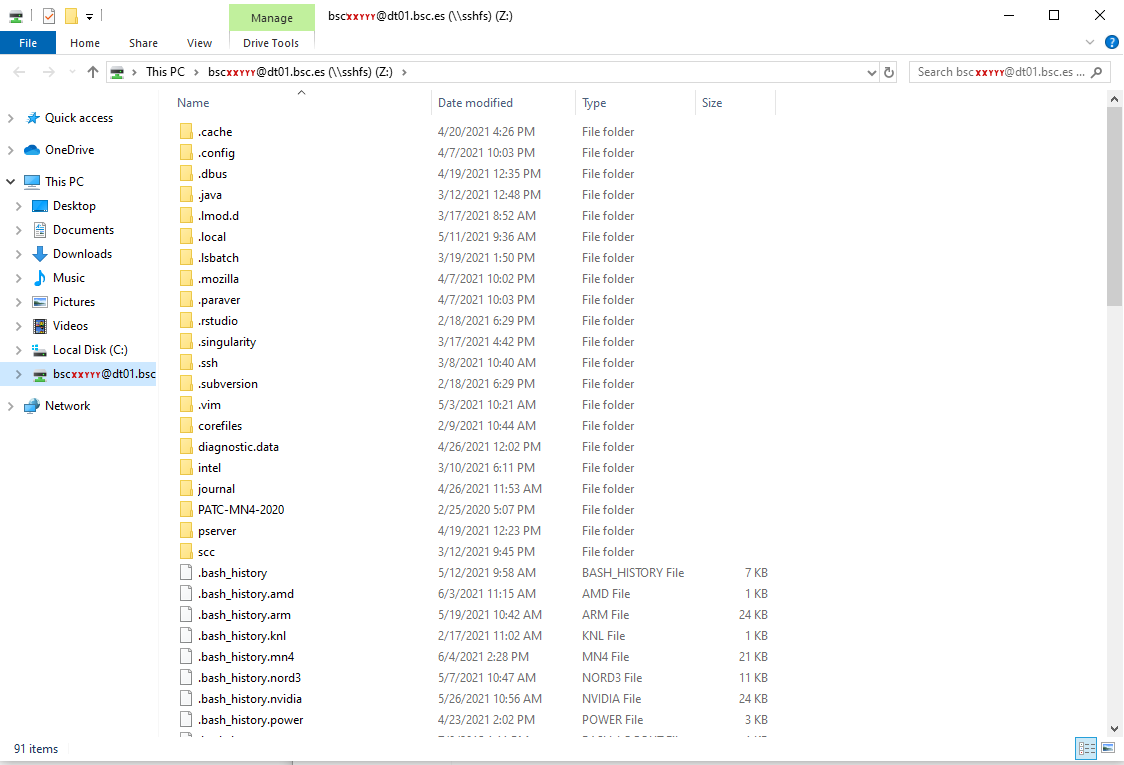
Done! win-sshfs
Install Dokan 1.0.5 (is the version that works best for us)
Install the latest version of win-sshfs. Even though the installer seems to do nothing, if you reboot your computer the direct access to the application will show up.
The configuration fields are:
% Drive name: whatever you want
% Host: dt01.bsc.es
% Port: 22
% Username: <your-username>
% Password: <your-password>
% Directory: directory you want to mount
% Drive letter: preferred
% Mount at login: preferred
% Mount folder: only necessary if you want to mount it over a directory, otherwise, empty
% Proxy: none
% KeepAlive: preferred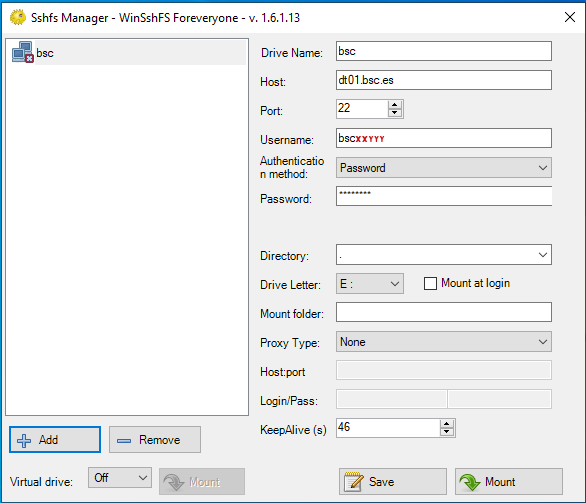
Example - After clicking “Mount” you should be able to access to your remote directory as a part of your filesystem.
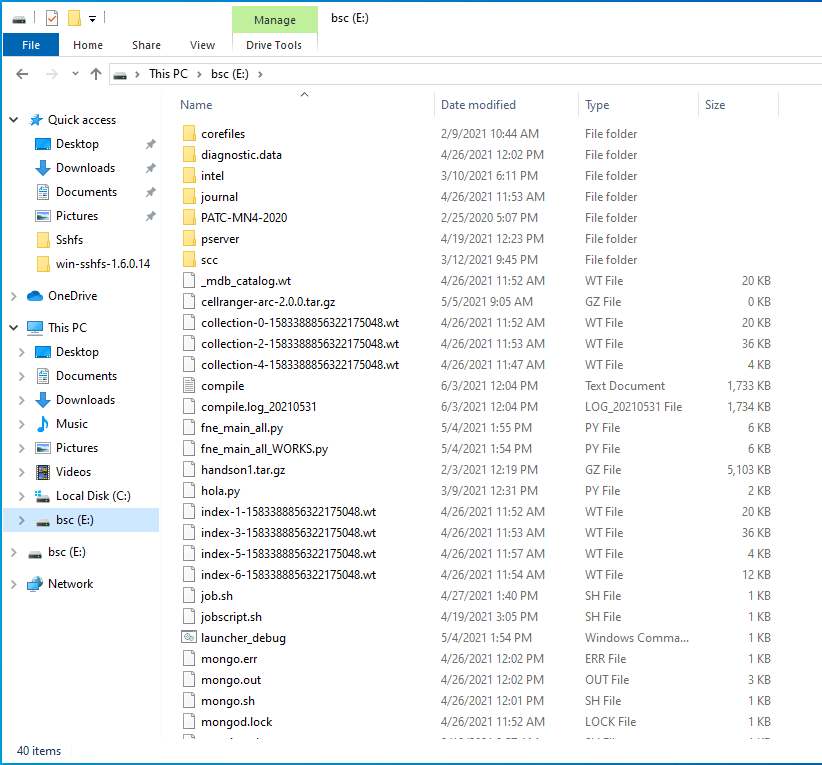
Done!
Data Transfer on the PRACE Network
PRACE users can use the 10Gbps PRACE Network for moving large data among PRACE sites. To get access to this service it’s required to contact “support@bsc.es” requesting its use, providing the local IP of the machine from where it will be used.
The selected data transfer tool is Globus/GridFTP which is available on dt02.bsc.es
In order to use it, a PRACE user must get access to dt02.bsc.es:
% ssh -l pr1eXXXX dt02.bsc.es
Load the PRACE environment with ‘module’ tool:
% module load prace globus
Create a proxy certificate using ‘grid-proxy-init’:
    % grid-proxy-init
    Your identity: /DC=es/DC=irisgrid/O=bsc-cns/CN=john.foo
    Enter GRID pass phrase for this identity:
    Creating proxy ........................................... Done
    Your proxy is valid until: Wed Aug  7 00:37:26 2013
    pr1eXXXX@dtransfer2:~>
The command ‘globus-url-copy’ is now available for transferring large data.
globus-url-copy [-p <parallelism>] [-tcp-bs <size>] <sourceURL> <destURL>
Where:
-p: specify the number of parallel data connections should be used (recommended value: 4)
-tcp-bs: specify the size (in bytes) of the buffer to be used by the underlying ftp data channels (recommended value: 4MB)
Common formats for sourceURL and destURL are:
- file:// (on a local machine only) (e.g. file:///home/pr1eXX00/pr1eXXXX/myfile)
- gsiftp:// (e.g. gsiftp://supermuc.lrz.de/home/pr1dXXXX/mydir/)
- remember that any url specifying a directory must end with /.
All the available PRACE GridFTP endpoints can be retrieved with the ‘prace_service’ script:
    % prace_service -i -f bsc
    gftp.prace.bsc.es:2811
More information is available at the PRACE website
Active Archive Management ↩
To move or copy from/to AA you have to use our special commands, available in dt01.bsc.es and dt02.bsc.es or any other machine by loading “transfer” module:
- dtcp, dtmv, dtrsync, dttar
These commands submit a job into a special class performing the selected command. Their syntax is the same than the shell command without ‘dt’ prefix (cp, mv, rsync, tar).
- dtq, dtcancel
dtq
dtq shows all the transfer jobs that belong to you, it works like squeue in SLURM.
dtcancel <job_id>
dtcancel cancels the transfer job with the job id given as parameter, it works like scancel in SLURM.
- dttar: submits a tar command to queues. Example: Taring data from /gpfs/ to /gpfs/archive/hpc
% dttar -cvf /gpfs/archive/hpc/group01/outputs.tar ~/OUTPUTS
- dtcp: submits a cp command to queues. Remember to delete the data in the source filesystem once copied to AA to avoid duplicated data.
    # Example: Copying data from /gpfs to /gpfs/archive/hpc
    % dtcp -r  ~/OUTPUTS /gpfs/archive/hpc/group01/
    # Example: Copying data from /gpfs/archive/hpc to /gpfs
    % dtcp -r  /gpfs/archive/hpc/group01/OUTPUTS ~/
- dtrsync: submits a rsync command to queues. Remember to delete the data in the source filesystem once copied to AA to avoid duplicated data.
    # Example: Copying data from /gpfs to /gpfs/archive/hpc
    % dtrsync -avP  ~/OUTPUTS /gpfs/archive/hpc/group01/
    # Example: Copying data from /gpfs/archive/hpc to /gpfs
    % dtrsync -avP  /gpfs/archive/hpc/group01/OUTPUTS ~/
- dtsgrsync: submits a rsync command to queues switching to the specified group as the first parameter. If you are not added to the requested group, the command will fail. Remember to delete the data in the source filesystem once copied to the other group to avoid duplicated data.
    # Example: Copying data from group01 to group02
    % dtsgrsync group02 /gpfs/projects/group01/OUTPUTS /gpfs/projects/group02/
- dtmv: submits a mv command to queues.
    # Example: Moving data from /gpfs to /gpfs/archive/hpc
    % dtmv ~/OUTPUTS /gpfs/archive/hpc/group01/
    # Example: Moving data from /gpfs/archive/hpc to /gpfs
    % dtmv /gpfs/archive/hpc/group01/OUTPUTS ~/
Additionally, these commands accept the following options:
--blocking: Block any process from reading file at final destination until transfer completed.

--time: Set up new maximum transfer time (Default is 18h).
It is
Repository management (GIT/SVN) ↩
There’s no outgoing internet connection from the cluster, which prevents the use of external repositories directly from our machines. To circumvent that, you can use the “sshfs” command in your local machine, as explained in the previous [Setting up sshfs (Linux)] and [Setting up sshfs (Windows)] sections.
Doing that, you can mount a desired directory from our GPFS filesystem in your local machine. That way, you can operate your GPFS files as if they were stored in your local computer. That includes the use of git, so you can clone, push or pull any desired repositories inside that mount point and the changes will transfer over to GPFS.
Running Jobs ↩
Slurm is the utility used for batch processing support, so all jobs must be run through it. This section provides information for getting started with job execution at the Cluster.
Important notices:
All jobs requesting 48 or more cores will automatically use all requested nodes in exclusive mode. For example if you request 49 cores you will receive two complete nodes (48 cores * 2 = 96 cores) and the consumed runtime of these 96 cores will be reflected in your budget.
The maximum amount of queued jobs (running or not) is 366. You can check this limit with bsc_queues.
Queues ↩
There are several queues present in the machines and different users may access different queues. All queues have different limits in amount of cores for the jobs and duration. You can check anytime all queues you have access to and their limits using:
% bsc_queues
The standard configuration and limits of the queues are the following
| Queue | Maximum numer of nodes (cores) | Maximum wallclock |
|---|---|---|
| Debug | 16 (768) | 2 h |
| Interactive | (max 4 cores) | 2 h |
| BSC | 50 (2400) | 48 h |
| RES Class A | 200 (9600) | 72 h |
| RES Class B | 200 (9600) | 48 h |
| RES Class C | 21 (1008) | 24 h |
| PRACE | 400 (19200) | 72 h |
For longer and/or larger executions special queues are available upon request and will require proof of scalability and application performance. To solicit access to these special queues please contact us.
Submitting jobs ↩
The method for submitting jobs is to use the SLURM sbatch directives directly.
A job is the execution unit for SLURM. A job is defined by a text file containing a set of directives describing the job’s requirements, and the commands to execute.
In order to ensure the proper scheduling of jobs, there are execution limitations in the number of nodes and cores that can be used at the same time by a group. You may check those limits using command ‘bsc_queues’. If you need to run an execution bigger than the limits already granted, you may [Contact Us]
SBATCH commands
These are the basic directives to submit jobs with sbatch:
sbatch <job_script>
submits a “job script” to the queue system (see Job directives).
squeue
shows all the submitted jobs.
scancel <job_id>
remove the job from the queue system, canceling the execution of the processes, if they were still running.
Interactive Sessions ↩
Allocation of an interactive session in the interactive partition has to be done through SLURM:
    salloc --partition=interactive
    or
    salloc -p interactive
Job directives ↩
A job must contain a series of directives to inform the batch system about the characteristics of the job. These directives appear as comments in the job script and have to conform to either the sbatch syntaxes.
sbatch syxtax is of the form:
#SBATCH --directive=value
Additionally, the job script may contain a set of commands to execute. If not, an external script may be provided with the ‘executable’ directive. Here you may find the most common directives for both syntaxes:
#SBATCH --qos=debug
To request the queue for the job. If it is not specified, Slurm will use the user’s default queue. The debug queue is only intended for small test.
#SBATCH --time=DD-HH:MM:SS
The limit of wall clock time. This is a mandatory field and you must set it to a value greater than real execution time for your application and smaller than the time limits granted to the user. Notice that your job will be killed after the time has passed.
#SBATCH --workdir=pathname
The working directory of your job (i.e. where the job will run). If not specified, it is the current working directory at the time the job was submitted.
#SBATCH --error=file
The name of the file to collect the standard error output (stderr) of the job.
#SBATCH --output=file
The name of the file to collect the standard output (stdout) of the job.
    #SBATCH --nodes=number
    or
    #SBATCH -N number
The number of requested nodes.
Note:Please keep in mind that this parameter will enforce the exclusivity of the nodes in case you request more than one. For example, let’s say that we specify just one node with this parameter, but we only want to use two tasks that use only one core each:
    #SBATCH -N 1
    #SBATCH -n 2
    #SBATCH -c 1
This will only request the use of the total resources, which are just two cores. The remaining resources of the used node will be left available for other users. If we request more than one node (and we leave the other parameters untouched) like this:
    #SBATCH -N 2
    #SBATCH -n 2
    #SBATCH -c 1
It will request the exclusivity of both nodes. This means that it will request the full resources of both nodes and they won’t be shared between other users. In MN4 each node has 48 cores, so this example will request 96 cores. It’s important to be aware of this behavior, as it will charge the CPU time of those 96 cores to your computation time budget (in case you have one), even if you specified the use of only two cores. With this being said, we can continue with the description of the remaining SLURM parameters.
#SBATCH --ntasks=number
The number of processes to start.
Optionally, you can specify how many threads each process would open with the directive:
#SBATCH --cpus-per-task=number
The number of cores assigned to the job will be the total_tasks number * cpus_per_task number.
#SBATCH --tasks-per-node=number
The number of tasks assigned to a node.
#SBATCH --ntasks-per-socket=number
The number of tasks assigned to a socket.
#SBATCH --constraint=highmem
Select which configuration to run your job on, for example “highmem” to run the job on a HighMem node with 7928 MB per core. Without this directive the jobs will be sent to standard nodes that have 1880 MB of RAM per core. There are only a limited number of high memory nodes available, 216 nodes (10368 cores) out of 3456 nodes (165888 cores) in total. Therefore when requesting these nodes you can expect significantly longer queueing times to fulfil the resource request before your job can start.
The accounting for one core hour in standard and highmem nodes is the same, e.g. 1 core hour per core per hour will be budgeted. For faster turnaround times in the queues you can also use standard nodes and run less processes per node. For this you will need to use more cores per task, as every cores requested comes with its 2 GB RAM. You can do this by specifying the flag #SBATCH –cpus-per-task=number and your budget will get charged for all cores requested.
#SBATCH --x11[=<all|batch|first|last>]
If it is set the job will be handled as graphical and Slurm will assign the necessary resources to the job, so you will be able to execute a graphical command and if you do not close the current terminal you will get a graphical window. Sets up X11 forwarding on all, batch host, first or last node(s) of the allocation.
#SBATCH --reservation=reservation_name
The reservation where your jobs will be allocated (assuming that your account has access to that reservation). In some ocasions, node reservations can be granted for executions where only a se t of accounts can run jobs. Useful for courses.
    #SBATCH --mail-type=[begin|end|all|none]
    #SBATCH --mail-user=<your_email>

    #Fictional example (notified at the end of the job execution):
    #SBATCH --mail-type=end
    #SBATCH --mail-user=dannydevito@bsc.es
Those two directives are presented as a set because they need to be used at the same time. They will enable e-mail notifications that are triggered when a job starts its execution (begin), ends its execution (end) or both (all). The “none” option doesn’t trigger any e-mail, it is the same as not putting the directives. The only requisite is that the e-mail specified is valid and also the same one that you use for the HPC User Portal (what is the HPC User Portal, you ask? Excellent question, check it out here!: https://www.bsc.es/user-support/hpc_portal.php)
#SBATCH --switches=number@timeout
By default, Slurm tries to schedule a job in order to use the minimum amount of switches. However, a user can request a maximum of switches for their jobs. Slurm will try to schedule the job for timeout minutes. If it is not possible to request number switches (each rack has 3 switches, every switch is connected to 24 nodes) after timeout minutes, Slurm will schedule the job by default.
#SBATCH --array=<indexes>
Submit a job array, multiple jobs to be executed with identical parameters. The indexes specification identifies what array index values should be used. Multiple values may be specified using a comma separated list and/or a range of values with a “-” separator. Job arrays will have two additional environment variable set. SLURM_ARRAY_JOB_ID will be set to the first job ID of the array. SLURM_ARRAY_TASK_ID will be set to the job array index value. For example:
    sbatch --array=1-3 job.cmd
    Submitted batch job 36
Will generate a job array containing three jobs and then the environment variables will be set as follows:
    # Job 1
    SLURM_JOB_ID=36
    SLURM_ARRAY_JOB_ID=36
    SLURM_ARRAY_TASK_ID=1

    # Job 2
    SLURM_JOB_ID=37
    SLURM_ARRAY_JOB_ID=36
    SLURM_ARRAY_TASK_ID=2

    # Job 3
    SLURM_JOB_ID=38
    SLURM_ARRAY_JOB_ID=36
    SLURM_ARRAY_TASK_ID=3
Note: the maximum number of elements that a job array can contain is 1000 jobs. Any number higher than that will result in an error when trying to submit the job.
#SBATCH --cpu-freq=<number>
Request that job steps initiated by srun commands inside this sbatch script be run at some requested frequency if possible, on the cores selected for the step on the compute node(s). Available frequency steps: 2.10 GHz, 2.00 GHz, 1.90 GHz, 1.80 GHz, 1.70 GHz, 1.60 GHz, 1.50 GHz, 1.40 GHz, 1.30 GHz, 1.20 GHz, 1.10 GHz, 1 GHz
The value is being given in KHz and therefore you will need to specify the values from 2100000 to 1000000.
By default both the turbo boost an speed step technologies are activated in MareNostrum4.
#SBATCH --exclusive
To request an exclusive use of a compute node without sharing the resources with other users. This only applies to jobs requesting less than one node (48 cores). All jobs with >= 48 cores will automatically use all requested nodes in exclusive mode.
| Variable | Meaning |
|---|---|
| SLURM_JOBID | Specifies the job ID of the executing job |
| SLURM_NPROCS | Specifies the total number of processes in the job |
| SLURM_NNODES | Is the actual number of nodes assigned to run your job |
| SLURM_PROCID | Specifies the MPI rank (or relative process ID) for the current process. The range is from 0-(SLURM_NPROCS–1) |
| SLURM_NODEID | Specifies relative node ID of the current job. The range is from 0-(SLURM_NNODES–1) |
| SLURM_LOCALID | Specifies the node-local task ID for the process within a job |
For more information:
    man sbatch
    man srun
    man salloc
Examples ↩
sbatch examples
Example for a sequential job:
    #!/bin/bash
    #SBATCH --job-name="test_serial"
    #SBATCH --workdir=.
    #SBATCH --output=serial_%j.out
    #SBATCH --error=serial_%j.err
    #SBATCH --ntasks=1
    #SBATCH --time=00:02:00
    ./serial_binary> serial.out
The job would be submitted using:
> sbatch ptest.cmd
Examples for a parallel job:
- Running a pure OpenMP job on one MN4 node using 48 cores on the debug queue:
    #!/bin/bash
    #SBATCH --job-name=omp
    #SBATCH --workdir=.
    #SBATCH --output=omp_%j.out
    #SBATCH --error=omp_%j.err
    #SBATCH --cpus-per-task=48
    #SBATCH --ntasks=1
    #SBATCH --time=00:10:00
    #SBATCH --qos=debug
    ./openmp_binary
- Running on two MN4 nodes using a pure MPI job
    #!/bin/bash
    #SBATCH --job-name=mpi
    #SBATCH --output=mpi_%j.out
    #SBATCH --error=mpi_%j.err
    #SBATCH --ntasks=96
    srun ./mpi_binary
- Running a hybrid MPI+OpenMP job on two MN4 nodes with 24 MPI tasks (12 per node), each using 4 cores via OpenMP:
    #!/bin/bash
    #SBATCH --job-name=test_parallel
    #SBATCH --workdir=.
    #SBATCH --output=mpi_%j.out
    #SBATCH --error=mpi_%j.err
    #SBATCH --ntasks=24
    #SBATCH --cpus-per-task=4
    #SBATCH --tasks-per-node=12
    #SBATCH --time=00:02:00
    srun ./parallel_binary> parallel.output
- Running on four high memory MN4 nodes with 1 task per node, each using 48 cores:
    #!/bin/bash
    #SBATCH --job-name=test_parallel
    #SBATCH --workdir=.
    #SBATCH --output=mpi_%j.out
    #SBATCH --error=mpi_%j.err
    #SBATCH --ntasks=4
    #SBATCH --cpus-per-task=48
    #SBATCH --tasks-per-node=1
    #SBATCH --time=00:02:00
    #SBATCH --constraint=highmem
    srun ./parallel_binary> parallel.output
Interpreting job status and reason codes ↩
When using squeue, Slurm will report back the status of your launched jobs. If they are still waiting to enter execution, they will be followed by the reason. Slurm uses codes to display this information, so in this section we will be covering the meaning of the most relevant ones.
Job state codes
This list contains the usual state codes for jobs that have been submitted:
- COMPLETED (CD): The job has completed the execution.
- COMPLETING (CG): The job is finishing, but some processes are still active.
- FAILED (F): The job terminated with a non-zero exit code.
- PENDING (PD): The job is waiting for resource allocation. The most common state after running “sbatch”, it will run eventually.
- PREEMPTED (PR): The job was terminated because of preemption by another job.
- RUNNING (R): The job is allocated and running.
- SUSPENDED (S): A running job has been stopped with its cores released to other jobs.
- STOPPED (ST): A running job has been stopped with its cores retained.
Job reason codes
This list contains the most common reason codes of the jobs that have been submitted and are still not in the running state:
- Priority: One or more higher priority jobs is in queue for running. Your job will eventually run.
- Dependency: This job is waiting for a dependent job to complete and will run afterwards.
- Resources: The job is waiting for resources to become available and will eventually run.
- InvalidAccount: The job’s account is invalid. Cancel the job and resubmit with correct account.
- InvaldQoS: The job’s QoS is invalid. Cancel the job and resubmit with correct account.
- QOSGrpCpuLimit: All CPUs assigned to your job’s specified QoS are in use; job will run eventually.
- QOSGrpMaxJobsLimit: Maximum number of jobs for your job’s QoS have been met; job will run eventually.
- QOSGrpNodeLimit: All nodes assigned to your job’s specified QoS are in use; job will run eventually.
- PartitionCpuLimit: All CPUs assigned to your job’s specified partition are in use; job will run eventually.
- PartitionMaxJobsLimit: Maximum number of jobs for your job’s partition have been met; job will run eventually.
- PartitionNodeLimit: All nodes assigned to your job’s specified partition are in use; job will run eventually.
- AssociationCpuLimit: All CPUs assigned to your job’s specified association are in use; job will run eventually.
- AssociationMaxJobsLimit: Maximum number of jobs for your job’s association have been met; job will run eventually.
- AssociationNodeLimit: All nodes assigned to your job’s specified association are in use; job will run eventually.
Resource usage and job priorities ↩
Projects will have assinged a certain amount of compute hours or core hours that are available to use. One core hour is the computing time of one core during the time of one hour. That is a full node with 48 cores running a job for one hour will use up 48 core hours from the assigned budget. The accounting is solely based in the amount of compute hours used.
The priority of a job and therefore its scheduling in the queues is being determined by a multitude of factors. The most important and influential ones are the fairshare in between groups, waiting time in queues and job size. MareNostrum is a system meant for and favouring large executions so that jobs using more cores have a higher priority. The time while waiting in queues for execution is being taken into account as well and jobs gain more and more priority the longer they are waiting. Finally our queue system implements a fairshare policy between groups. Users who did not run many jobs and consumed compute hours will get a higher priority for their jobs than groups that have a high usage. This is to allow everyone their fair share of compute time and the option to run jobs without one group or another being favoured. You can review your current fair share score using the command
sshare -la
Notifications
It is currently not possible to be notified about the status of jobs via email. To check if your jobs are being executed or have finished you will need to connect to the system and verify their status manually. For the future it is being planned to enable automatic notifications.
Software Environment ↩
All software and numerical libraries available at the cluster can be found at /apps/. If you need something that is not there please contact us to get it installed (see Getting Help).
Compilation for the architecture ↩
To generate code that is optimized for the target architecture and the supported features such as SSE, MMX, AVX instruction sets you will have to use the corresponding compile flags. For compilations of MPI applications an MPI installation needs to be loaded in your session as well. For example Intel MPI via module load impi/2017.4
Intel Compilers
The latest Intel compilers provide the best possible optimizations for the Xeon Platinum architecture. By default, when starting a new session on the system the basic modules for the Intel suite will be automatically loaded. That is the compilers (intel/2017.4), the Intel MPI software stack (impi/2017.4) and the math kernel libraries MKL (mkl/2017.4) in their latest versions. We highly recommend linking against MKL where supported to achieve the best performance results.
To separately load the Intel compilers please use
module load intel/2017.4
The corresponding optimization flags for icc are CFLAGS=“-xCORE-AVX512 -mtune=skylake”. As the login nodes are of the exact same architecture as the compute node you can also use the flag -xHost which enables all possible optimizations available on the compile host.
Intel Compiler Licences ↩
For reasons of licensing we recommend compiling using either login1 or the partition interactive. We currently have node locked licences installed that allow unlimited compilations in the machines login1 and the ones available via the queue interactive (logins 4 and 5). To compile in the rest of the compute and login nodes we have a limited amount of floating licences available. Should all of them be in use when trying to compile, you will experience a delay when the compiler starts and tries to checkout a licence.
In this case an error message like the one below will appear. In this case please switch to Login 1, Login 4 or Login 5 to compile without limitations and licencing issues.
    ifort: error #10052: could not checkout FLEXlm license

    Error: A license for Comp-CL is not available (-9,57).

    License file(s) used were (in this order):
        1.  Trusted Storage
    **  2.
      /gpfs/apps/MN4/INTEL/2017.4/compilers_and_libraries_2017.4.196/linux/bin/intel64/../../Licenses
    **  3.  /home/bsc18/bsc1888//Licenses
    **  4.  /opt/intel/licenses
    **  5.  /Users/Shared/Library/Application Support/Intel/Licenses
    **  6.
      /gpfs/apps/MN4/INTEL/2017.4/compilers_and_libraries_2017.4.196/linux/bin/intel64/license.lic
    **  7.
      /gpfs/apps/MN4/INTEL/2017.4/compilers_and_libraries_2017.4.196/linux/bin/intel64/login1_COM_L___1.lic
    **  8.
      /gpfs/apps/MN4/INTEL/2017.4/compilers_and_libraries_2017.4.196/linux/bin/intel64/login4_COM_L___1.lic
    **  9.
      /gpfs/apps/MN4/INTEL/2017.4/compilers_and_libraries_2017.4.196/linux/bin/intel64/login5_COM_L___1.lic

    Please refer http://software.intel.com/sites/support/ for more information..
GCC
The GCC provided by the system is version 4.8.5. For better support of new and old hardware features we have different versions that can be loaded via the provided modules. For example in MareNostrum you can find GCC 9.2.0
module load gcc/9.2.0
The corresponding flags are CFLAGS=“-march=skylake-avx512”
C Compilers ↩
In the cluster you can find these C/C++ compilers :
icc / icpc -> Intel C/C++ Compilers
    % man icc
    % man icpc
Note: in case you are planning on using Intel compilers, we strongly recommend using the ones from our “intel” modules with a version higher than 2017.4.
gcc /g++ -> GNU Compilers for C/C++
    % man gcc
    % man g++
All invocations of the C or C++ compilers follow these suffix conventions for input files:
.C, .cc, .cpp, or .cxx -> C++ source file.
.c -> C source file
.i -> preprocessed C source file
.so -> shared object file
.o -> object file for ld command
.s -> assembler source file
By default, the preprocessor is run on both C and C++ source files.
These are the default sizes of the standard C/C++ datatypes on the machine
| Type | Length (bytes) |
|---|---|
| bool (c++ only) | 1 |
| char | 1 |
| wchar_t | 4 |
| short | 2 |
| int | 4 |
| long | 8 |
| float | 4 |
| double | 8 |
| long double | 16 |
Distributed Memory Parallelism
To compile MPI programs it is recommended to use the following handy wrappers: mpicc, mpicxx for C and C++ source code. You need to choose the Parallel environment first: module load openmpi / module load impi / module load poe. These wrappers will include all the necessary libraries to build MPI applications without having to specify all the details by hand.
    % mpicc a.c -o a.exe
    % mpicxx a.C -o a.exe
Shared Memory Parallelism
OpenMP directives are fully supported by the Intel C and C++ compilers. To use it, the flag -qopenmp must be added to the compile line.
    % icc -qopenmp -o exename filename.c
    % icpc -qopenmp -o exename filename.C
You can also mix MPI + OPENMP code using -openmp with the mpi wrappers mentioned above.
Automatic Parallelization
The Intel C and C++ compilers are able to automatically parallelize simple loop constructs, using the option “-parallel” :
% icc -parallel a.c
FORTRAN Compilers ↩
In the cluster you can find these compilers :
ifort -> Intel Fortran Compilers
% man ifort
gfortran -> GNU Compilers for FORTRAN
% man gfortran
By default, the compilers expect all FORTRAN source files to have the extension “.f”, and all FORTRAN source files that require preprocessing to have the extension “.F”. The same applies to FORTRAN 90 source files with extensions “.f90” and “.F90”.
Distributed Memory Parallelism
In order to use MPI, again you can use the wrappers mpif77 or mpif90 depending on the source code type. You can always man mpif77 to see a detailed list of options to configure the wrappers, ie: change the default compiler.
% mpif77 a.f -o a.exe
Shared Memory Parallelism
OpenMP directives are fully supported by the Intel Fortran compiler when the option “-qopenmp” is set:
% ifort -qopenmp
Automatic Parallelization
The Intel Fortran compiler will attempt to automatically parallelize simple loop constructs using the option “-parallel”:
% ifort -parallel
Modules Environment ↩
The Environment Modules package (http://modules.sourceforge.net/) provides a dynamic modification of a user’s environment via modulefiles. Each modulefile contains the information needed to configure the shell for an application or a compilation. Modules can be loaded and unloaded dynamically, in a clean fashion. All popular shells are supported, including bash, ksh, zsh, sh, csh, tcsh, as well as some scripting languages such as perl.
Installed software packages are divided into five categories:
- Environment: modulefiles dedicated to prepare the environment, for example, get all necessary variables to use openmpi to compile or run programs
- Tools: useful tools which can be used at any time (php, perl, …)
- Applications: High Performance Computers programs (GROMACS, …)
- Libraries: Those are tipycally loaded at a compilation time, they load into the environment the correct compiler and linker flags (FFTW, LAPACK, …)
- Compilers: Compiler suites available for the system (intel, gcc, …)
Modules tool usage
Modules can be invoked in two ways: by name alone or by name and version. Invoking them by name implies loading the default module version. This is usually the most recent version that has been tested to be stable (recommended) or the only version available.
% module load intel
Invoking by version loads the version specified of the application. As of this writing, the previous command and the following one load the same module.
% module load intel/2017.4
The most important commands for modules are these:
- module list shows all the loaded modules
- module avail shows all the modules the user is able to load
- module purge removes all the loaded modules
- module load <modulename> loads the necessary environment variables for the selected modulefile (PATH, MANPATH, LD_LIBRARY_PATH…)
- module unload <modulename> removes all environment changes made by module load command
- module switch <oldmodule> <newmodule> unloads the first module (oldmodule) and loads the second module (newmodule)
You can run “module help” any time to check the command’s usage and options or check the module(1) manpage for further information.
Module custom stack size
The stack size is 2GB by default, but there are modules that can change that value when they are loaded. That’s to prevent errors that would happen otherwise (for example, while using python threads). Here’s a list of the affected modules:
- python/3-intel–2018.2 (64 MB)
- python/2-intel–2018.2 (64 MB)
- python/2.7.13 (10 MB)
- python/2.7.13_ML (64 MB)
- python/2.7.14 (10 MB)
- python/3.6.1 (10 MB)
- python/3.6.4_ML (64 MB)
- paraview/5.4.0 (64 MB)
- paraview/5.5.2 (64 MB)
- vmd/1.9.3 (64 MB)
- vmd/1.9.3-python (64 MB)
- igv/2.3.94 (64 MB)
You can check your stack size at any time using the command:
% ulimit -s
If by any chance this stack size doesn’t fit your needs, you can add to your job script a command to have a custom set value after the module load commands. This way, you can have an appropiate stack size while using the compute nodes:
% ulimit -Ss <new_size_in_KB>
BSC Commands ↩
The Support team at BSC has provided some commands useful for user’s awareness and ease of use in our HPC machines. A short summary of these commands follows:
- bsc_queues: Show the queues the user has access to and their time/resources limits.
- bsc_quota: Show a comprehensible quota usage summary for all accessible filesystems.
- bsc_acct: Displays accounting information on the project’s allocation usage.
- bsc_load: Displays job load information across all related computing nodes.
All available commands have a dedicated manpage (not all commands are available for all machines). You can check more information about these commands checking their respective manpage:
% man <bsc_command>

For example:
% man bsc_quota
PRACE ↩
A large part of MareNostrums capacities is reserved for users of the PRACE Research Infrastructure. There are regular calls ongoing to gain access to the system via this way and more information can be found here.
Compute hour allocation ↩
PRACE projects that have been awarded compute hours are expected to start their work and the consumption of hours immediately when the project begins The allocated hours are meant to be consumed consistently and proportionally during the projects lifetime. To aid users of the system we will regularly inform those groups by mail that are exhibiting a usage below the proportional average for their project.
To avoid the accumulation of too many hours towards the end of the project when it might be complicated to use them up fully we implement a sliding usage window of 3 months. This means that after 3 months the hours of the first month that have not been consumed will count as used up and deducted from the total of available compute hours. The sliding-window is moved every 3 months, so we will deduct hours on the month 3rd, 6th and 9th of the project:
- 3rd Month: Hours of one month deducted if not consumed
- 6th Month: Hours of four months deducted if not consumed
- 9th Month: Hours of seven months deduccted if not consumed
For example a 12 months project has been awarded with 12 Mio core hours and starts in January. The monthly proportional consumption is therefore 1 Mio core hours. Due to a sabbatical of the PIs group in Menorca the actual usage of the project only starts in April. Therefore 1 Mio core hours from the month of January will be deducted from the total assignation. If the group continues to consume normally the remaining 11 Mio core hours can be used up entirely.
This regulation does not affect overconsumption of the awarded compute hours. Therefore you could also use up all of your hours within the first month of the project.
Getting help ↩
BSC provides users with excellent consulting assistance. User support consultants are available during normal business hours, Monday to Friday, 09 a.m. to 18 p.m. (CEST time).
User questions and support are handled at: support@bsc.es
If you need assistance, please supply us with the nature of the problem, the date and time that the problem occurred, and the location of any other relevant information, such as output files. Please contact BSC if you have any questions or comments regarding policies or procedures.
Our address is:
Barcelona Supercomputing Center – Centro Nacional de Supercomputación
C/ Jordi Girona, 31, Edificio Capilla 08034 Barcelona
Frequently Asked Questions (FAQ) ↩
You can check the answers to most common questions at BSC’s Support Knowledge Center. There you will find online and updated versions of our documentation, including this guide, and a listing with deeper answers to the most common questions we receive as well as advanced specific questions unfit for a general-purpose user guide.
Appendices ↩
SSH ↩
SSH is a program that enables secure logins over an insecure network. It encrypts all the data passing both ways, so that if it is intercepted it cannot be read. It also replaces the old an insecure tools like telnet, rlogin, rcp, ftp,etc. SSH is a client-server software. Both machines must have ssh installed for it to work.
We have already installed a ssh server in our machines. You must have installed an ssh client in your local machine. SSH is available without charge for almost all versions of UNIX (including Linux and MacOS X). For UNIX and derivatives, we recommend using the OpenSSH client, downloadable from http://www.openssh.org, and for Windows users we recommend using Putty, a free SSH client that can be downloaded from http://www.putty.org. Otherwise, any client compatible with SSH version 2 can be used. If you want to try a simpler client with multi-tab capabilities, we also recommend using Solar-PuTTY (https://www.solarwinds.com/free-tools/solar-putty).
This section describes installing, configuring and using PuTTy on Windows machines, as it is the most known Windows SSH client. No matter your client, you will need to specify the following information:
- Select SSH as default protocol
- Select port 22
- Specify the remote machine and username
For example with putty client:
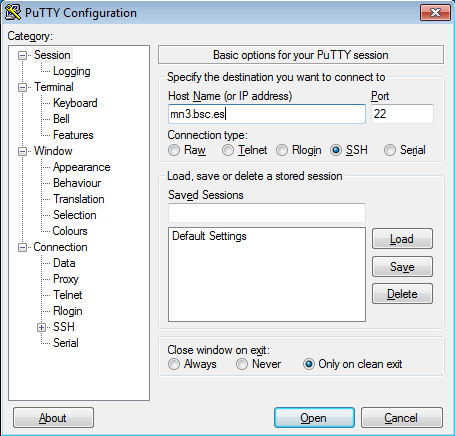
This is the first window that you will see at putty startup. Once finished, press the Open button. If it is your first connection to the machine, your will get a Warning telling you that the host key from the server is unknown, and will ask you if you are agree to cache the new host key, press Yes.
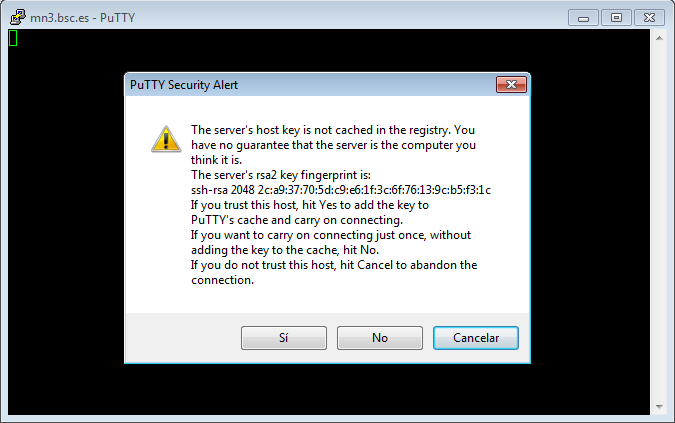
IMPORTANT: If you see this warning another time and you haven’t modified or reinstalled the ssh client, please do not log in, and contact us as soon as possible (see Getting Help).
Finally, a new window will appear asking for your login and password:
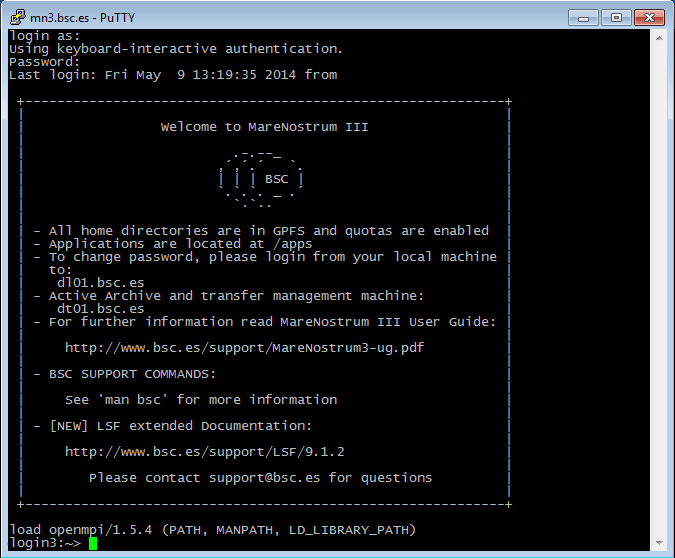
Generating SSH keys with PuTTY
First of all, open PuTTY Key Generator. You should select Type RSA and 2048 or 4096 bits, then hit the “Generate” button.
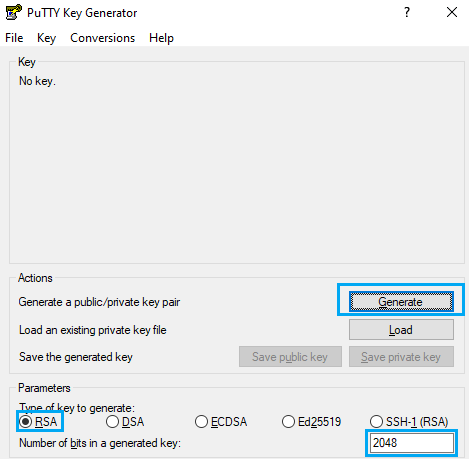
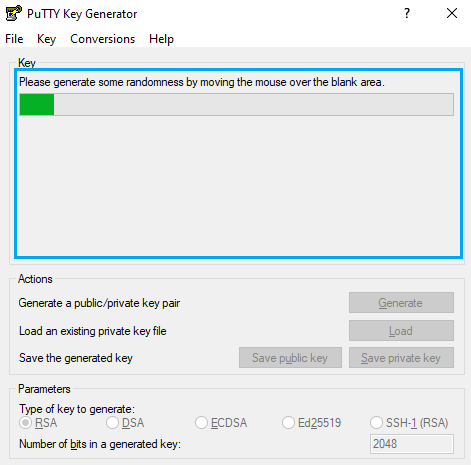
After that, you will have to move the mouse pointer inside the blue rectangle, as in picture:
You will find and output similar to the following picture when completed
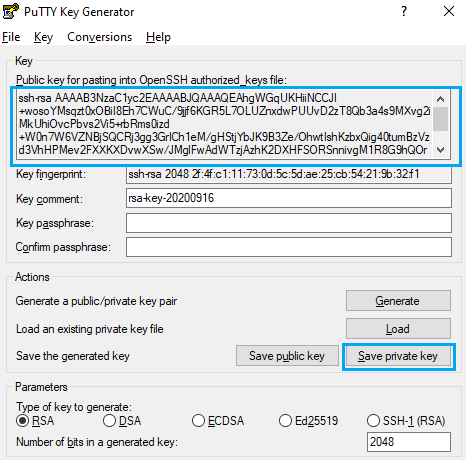
This is your public key, you can copy the text in the upper text box to the notepad and save the file. On the other hand, click on “Save private key” as in the previous picture, then export this file to your desired path.
You can close PuTTY Key Generator and open PuTTY by this time,
To use your recently saved private key go to Connection -> SSH -> Auth, click on Browse… and select the file.

Transferring files on Windows ↩
To transfer files to or from the cluster you need a secure FTP (SFTP) o secure copy (SCP) client. There are several different clients, but as previously mentioned, we recommend using the Putty clients for transferring files: psftp and pscp. You can find them at the same web page as PuTTY (http://www.putty.org), you just have to go to the download page for PuTTY and you will see them in the “alternative binary files” section of the page. They will most likely be included in the general PuTTY installer too.
Some other possible tools for users requiring graphical file transfers could be:
- WinSCP: Freeware SCP and SFTP client for Windows (http://www.winscp.net)
- Solar-PuTTY: Free alternative to PuTTY that also has graphical interfaces for SCP/SFTP. (https://www.solarwinds.com/free-tools/solar-putty)
Using PSFTP
You will need a command window to execute psftp (press start button, click run and type cmd). The program first asks for the machine name (mn1.bsc.es), and then for the username and password. Once you are connected, it’s like a Unix command line.
With command help you will obtain a list of all possible commands. But the most useful are:
- get file_name : To transfer from the cluster to your local machine.
- put file_name : To transfer a file from your local machine to the cluster.
- cd directory : To change remote working directory.
- dir : To list contents of a remote directory.
- lcd directory : To change local working directory.
- !dir : To list contents of a local directory.
You will be able to copy files from your local machine to the cluster, and from the cluster to your local machine. The syntax is the same that cp command except that for remote files you need to specify the remote machine:
Copy a file from the cluster:
> pscp.exe username@mn1.bsc.es:remote_file local_file
Copy a file to the cluster:
> pscp.exe local_file username@mn1.bsc.es:remote_file
Using X11 ↩
In order to start remote X applications you need and X-Server running in your local machine. Here are two of the most common X-servers for Windows:
- Cygwin/X: http://x.cygwin.com
- X-Win32 : http://www.starnet.com
The only Open Source X-server listed here is Cygwin/X, you need to pay for the other.
Once the X-Server is running run putty with X11 forwarding enabled:
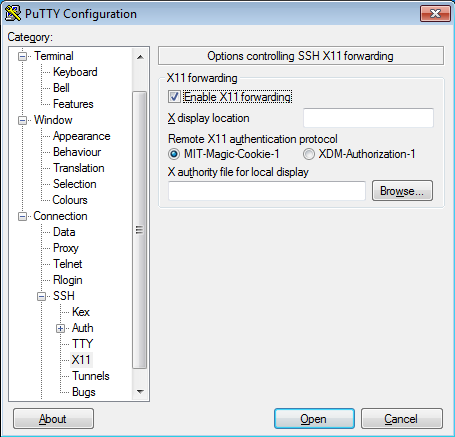
On the other hand, XQuartz is the most common application for this purpose in macOS. You can download it from its website:
For older versions of macOS or XQuartz you may need to add these commands to your .zshrc file and open a new terminal:
export DISPLAY=:0
/opt/X11/bin/xhost +
This will allow you to use the local terminal as well as xterm to launch graphical applications remotely.
If you installed another version of XQuartz in the past, you may need to launch the following commands to get a clean installation:
    $ launchctl unload /Library/LaunchAgents/org.macosforge.xquartz.startx.plist
    $ sudo launchctl unload /Library/LaunchDaemons/org.macosforge.xquartz.privileged_startx.plist
    $ sudo rm -rf /opt/X11* /Library/Launch*/org.macosforge.xquartz.* /Applications/Utilities/XQuartz.app /etc/*paths.d/*XQuartz
    $ sudo pkgutil --forget org.macosforge.xquartz.pkg
I tried running a X11 graphical application and got a GLX error, what can I do?
If you are running on a macOS/Linux system and, when you try to use some kind of graphical interface through remote SSH X11 remote forwarding, you get an error similar to this:
X Error of failed request: BadValue (integer parameter out of range for operation)
    Major opcode of failed request: 154 (GLX)
    Minor opcode of failed request: 3 (X_GLXCreateContext)
    Value in failed request: 0x0
    Serial number of failed request: 61
    Current serial number in output stream: 62
Try to do this fix:
macOS:
- Open a command shell, type, and execute:
$ defaults find xquartz | grep domain
You should get something like ‘org.macosforge.xquartz.X11’ or ‘org.xquartz.x11’, use this text in the following command (we will use org.xquartz.x11 for this example):
$ defaults write org.xquartz.x11 enable_iglx -bool true
- Reboot your computer.
Linux:
- Edit (as root) your Xorg config file and add this:
    Section "ServerFlags"
        Option "AllowIndirectGLX" "on"
        Option "IndirectGLX" "on"
    EndSection
- Reboot your computer.
This solves the error most of the time. The error is related to the fact that some OS versions have disabled indirect GLX by default, or disabled it at some point during an OS update.
Requesting and installing a .X509 user certificate ↩
If you are a BSC employee (and you also have a PRACE account), you may be interested in obtaining and configuring a x.509 Grid certificate. If that is the case, you should follow this guide. First, you should obtain a certificate following the details of this guide (you must be logged in the BSC intranet):
Once you have finished requesting the certificate, you must download it in a “.p12” format. This procedure may be different depending on which browser you are using. For example, if you are using Mozilla Firefox, you should be able to do it following these steps:
- Go to “Preferences”.
- Navigate to the “Privacy & Security” tab.
- Scroll down until you reach the “Certificates” section. Then, click on “View Certificates…”
- You should be able to select the certificate you generated earlier. Click on “Backup…”.
- Save the certificate as “usercert.p12”. Give it a password of your choice.
Once you have obtained the copy of your certificate, you must set up your environment in your HPC account. To acomplish that, follow these steps:
- Connect to dt02.bsc.es using your PRACE account.
- Go to the GPFS home directory of your HPC account and create a directory named “.globus”.
- Upload the .p12 certificate you created earlier inside that directory.
- Once you are logged in, insert the following commands (insert the password you chose when needed):
    module load prace globus
    cd ~/.globus
    openssl pkcs12 -nocerts -in usercert.p12 -out userkey.pem
    chmod 0400 userkey.pem
    openssl pkcs12 -clcerts -nokeys -in usercert.p12 -out usercert.pem
    chmod 0444 usercert.pem
Once you have finished all the steps, your personal certificate should be fully installed.
