The team is in charge of all aspects of data management within the Earth Sciences Department: from software development (visualization, computation of statistics, data formatting, physical diagnostics) to exploration of new technologies for Earth Sciences
Summary
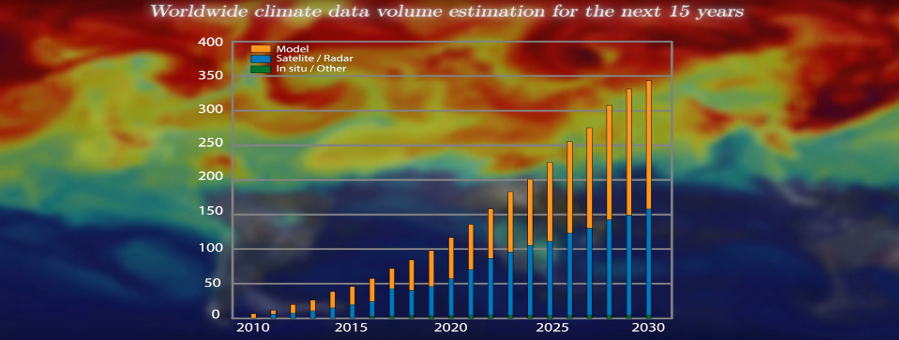
Weather, climate and air quality data are dramatically increasing in volume and complexity, just as their users rapidly increase in number and diversity. This suggests a new paradigm of more user-friendly and fast access to these data to ensure that society can reduce vulnerability to weather extremes, air quality events, and climate variability and change, while at the same time exploiting opportunities for a better management of sensitive systems. These communities offer a perfect example of the famous four Vs in Big Data: volume, velocity, veracity and variety. The bulk of weather, climate and air quality data is created by process-based models of the Earth system and the huge of variety of Earth Observation (EO) instruments (satellites, in situ, …). The availability and accessibility of observational data are mandatory to improve numerical models’ predictions both through data assimilation (inside the execution workflow) and model performances evaluation (diagnostics of models outputs comparison against observations). Improvements in these models take into account an increasing number of physical phenomena, leading to codes that require larger computers, with increased resolution and more processes that imply more variables to both analyse and disseminate. Critical steps such as online post-processing, offline data mining and dissemination of the simulated datasets, often with different formats and standards, and the observational data used to validate them, all have Big Data requirements.
Objectives
- Download, format and store data requested by the members of the department. This task has to be maintained at the current level and try to, if possible, increase the performance and reduce the complexity (automatise) of this task.
- Develop and maintain tools to access the data in an efficient way. This includes the installation of an internal THREDDS server, the deployment of an external ESGF data node and all the tools to use these data services.
- Develop diagnostics and metrics for all the experiments performed at the department. The diagnostics should help reducing the number of variables to be stored. The projects funding this activity will have priority.
- The software should be susceptible to be used as the simulation runs to reduce the data traffic. The diagnostics and metrics should be developed using methods and technologies not only suitable for the department but also for other teams around the world. All the developments will be shared with others groups and should foster their external usage (in this sense, public repositories or BSC gitlab server will play a key role). The software developed to perform the diagnostics and metrics should consider relevant computational aspects: performance, portability, documentation, I/O usage or memory bandwidth are issues to be always analyzed. Appropriate collaborations with the Computer Science department should be established.
- Data visualization and data display for scientific use and to disseminate the department research to different audiences. The team should develop knowledge to build and design outstanding visualization. This should be done in collaboration with the Services Group and the BSC Visualization team.